The ATL 2021 Top Law School Rankings
Most people attend law school to obtain jobs as lawyers, or at least they should.
Law school student loans are real, and they are huge, so you’d best have a plan to pay them off on the back end of your J.D. The economic upheaval caused by the global pandemic has supercharged the need to focus on employment data as the number 1 factor in picking a law school, and ATL has your back on this one. Check out our list for the law schools most likely to see you gainfully employed. After all, if you want to go to law school, you’re probably going to want a job when it’s over.
Which law schools are putting their graduates in a position to get jobs? And which ones are leaving their students with little more than a diploma and a dream?
We welcome you to the ninth annual installment of the Above the Law Top 50 Law School Rankings. These are the only rankings to incorporate the latest ABA employment data concerning the class of 2020. The premise underlying our approach to ranking schools remains the same: Given the steep cost of law school and the harsh realities of the legal job market—exacerbated by the continuing fallout from the global pandemic—potential students should prioritize their future employment prospects over all other factors in deciding whether and where to attend law school. The relative quality of schools is a function of how they deliver on the promise of gainful legal employment.
Our list is limited to 50 schools. We want to look at "national" schools, the ones with quality employment prospects both outside of their particular region and/or for graduates who don’t graduate at the top of the class.
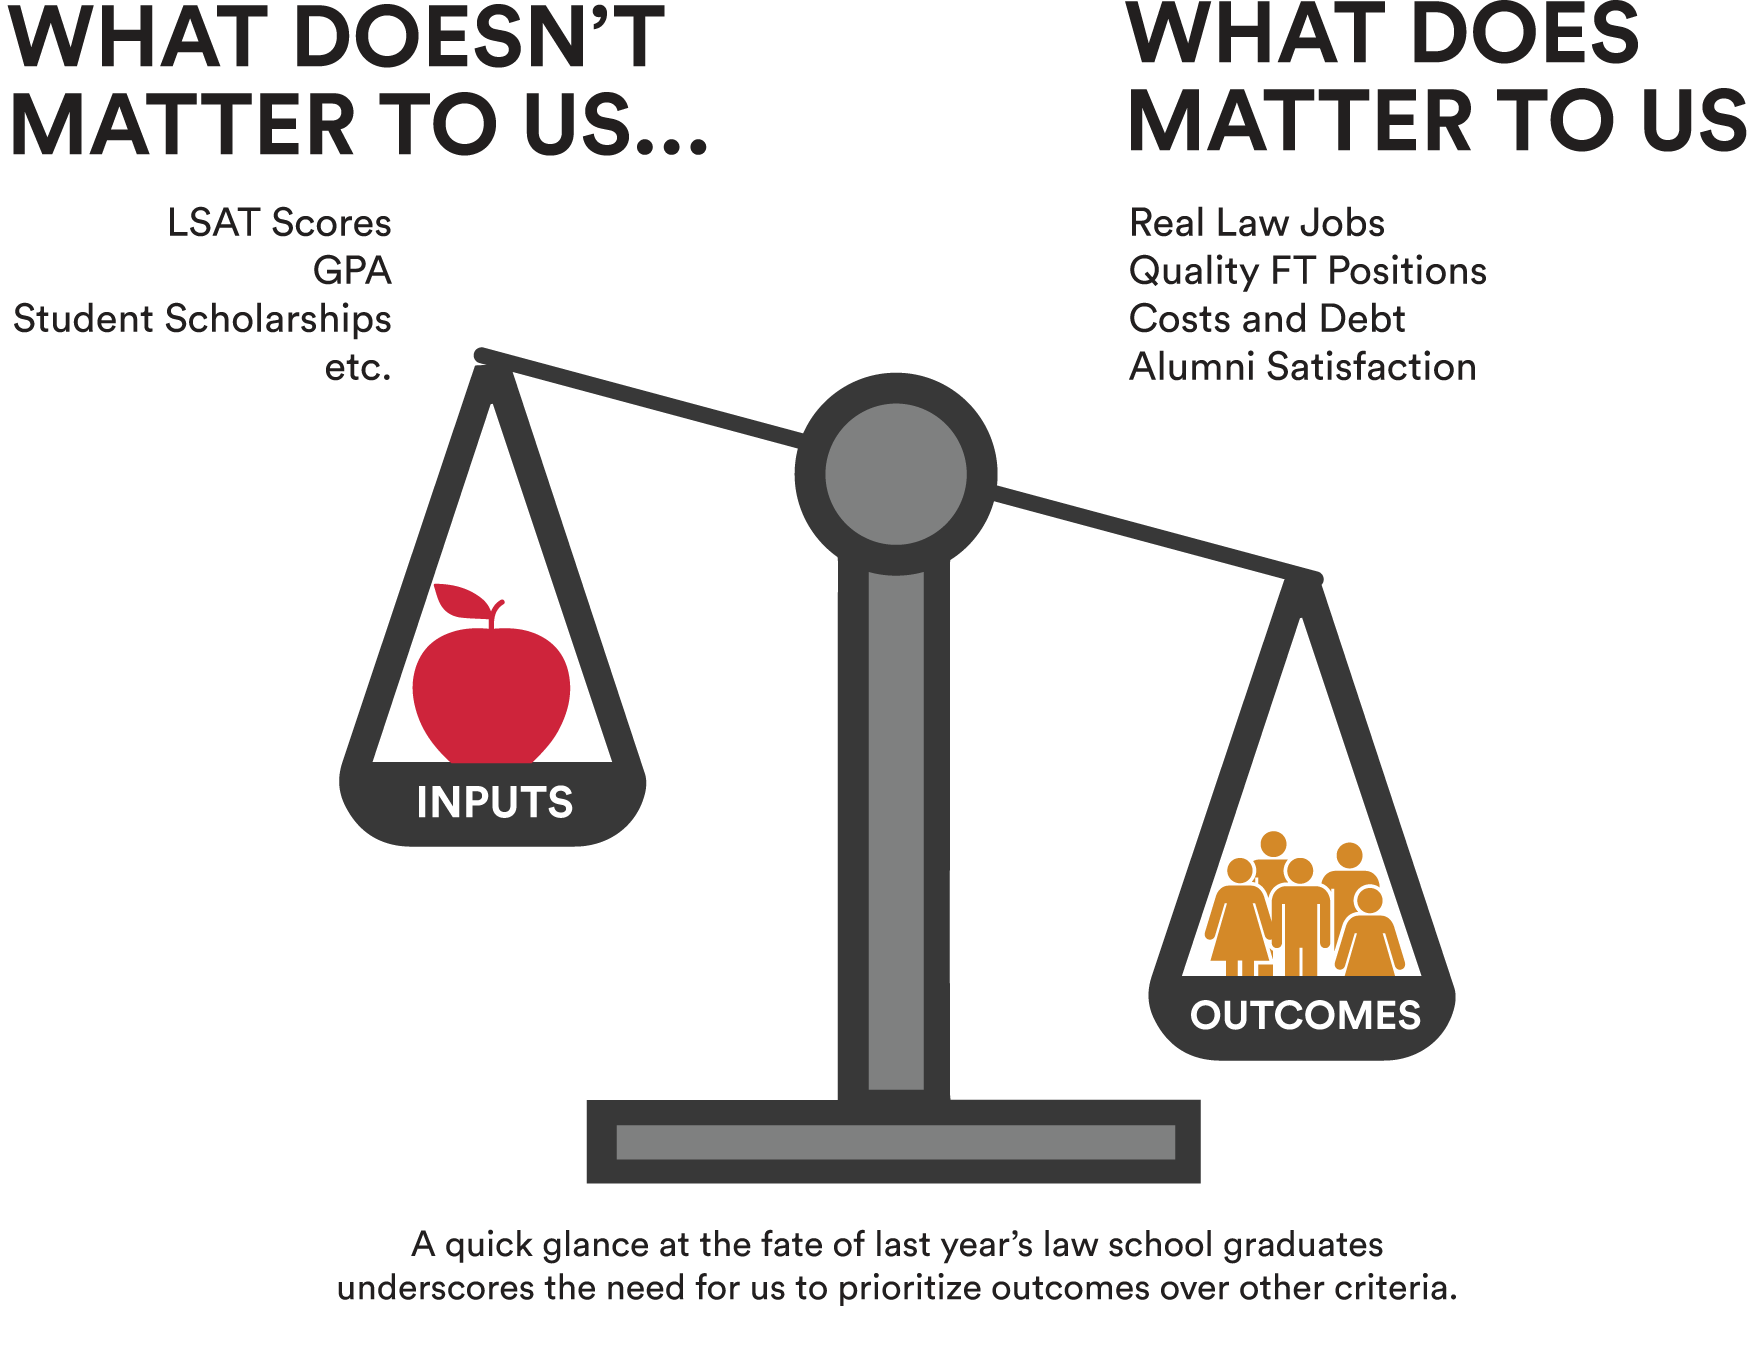
The ATL Top 50 Law School Rankings keep an exclusive focus on the only thing that really matters: outcomes.
The Rankings See the 2020 rankings →
How do law schools fare when assessed using this outcomes-based methodology?
| 2021 Rank | School | 2020 Rank | Change | Score |
|---|---|---|---|---|
| 1 | U Chicago | 2 | 1 | 79.67 |
| 2 | U Virginia | 3 | 1 | 76.83 |
| 3 | Duke | 1 | -2 | 74.49 |
| 4 | Cornell | 9 | 5 | 72.1 |
| 5 | U Michigan - Ann Arbor | 4 | -1 | 72.01 |
| 6 | Yale | 7 | 1 | 71.37 |
| 7 | U Penn (Carey) | 5 | -2 | 69.7 |
| 8 | Stanford | 6 | -2 | 68.37 |
| 9 | Washington University in St. Louis | 14 | 5 | 67.75 |
| 9 | Harvard | 8 | -1 | 67.75 |
| 11 | UC Berkeley | 13 | 2 | 65.53 |
| 12 | Northwestern | 10 | -2 | 64.54 |
| 13 | Columbia | 12 | -1 | 64.28 |
| 14 | U Texas - Austin | 15 | 1 | 63.56 |
| 15 | Vanderbilt | 11 | -4 | 63.14 |
| 16 | NYU | 17 | 1 | 60.64 |
| 17 | U Alabama | 29 | 12 | 60.56 |
| 18 | UCLA | 21 | 3 | 60.38 |
| 19 | U Iowa | 20 | 1 | 59.97 |
| 20 | Georgetown | 26 | 6 | 59.05 |
| 21 | University of Notre Dame | 16 | -5 | 57.44 |
| 22 | U Georgia | 18 | -4 | 56.81 |
| 23 | U Florida (Levin) | 24 | 1 | 56.23 |
| 24 | U North Carolina - Chapel Hill | 36 | 12 | 56.11 |
| 25 | U Illinois - Urbana Champaign | 19 | -6 | 55.1 |
| 26 | Ohio State University | 34 | 8 | 54.54 |
| 27 | USC | 28 | 1 | 54.38 |
| 28 | Washington and Lee University | 27 | -1 | 53.62 |
| 29 | Boston University | 23 | -6 | 52.42 |
| 30 | Wake Forest University | 33 | 3 | 52.06 |
| 31 | William and Mary | 42 | 11 | 51.59 |
| 32 | Boston College | 22 | -10 | 51.41 |
| 33 | U Kentucky | 39 | 6 | 51.01 |
| 34 | University of Utah (Quinney) | NR | N/A | 50.8 |
| 35 | Villanova | 32 | -3 | 49.43 |
| 36 | Brigham Young University | 47 | 11 | 49.18 |
| 37 | Drexel University | NR | N/A | 49 |
| 38 | Wayne State | NR | N/A | 47.72 |
| 39 | U Tennessee - Knoxville | 41 | 2 | 47.36 |
| 40 | Florida State | 45 | 5 | 47.25 |
| 41 | U Minnesota | 25 | -16 | 47.18 |
| 42 | U Wisconsin - Madison | 30 | -12 | 46.85 |
| 43 | U Nebraska - Lincoln | 49 | 6 | 46.36 |
| 44 | U Kansas | NR | N/A | 45.58 |
| 45 | U South Carolina | NR | N/A | 45.45 |
| 46 | Texas A&M | NR | N/A | 45.2 |
| 47 | U Houston | NR | N/A | 45.18 |
| 48 | Seton Hall | 44 | -4 | 45.03 |
| 49 | U Arkansas - Fayetteville | NR | N/A | 44.64 |
| 50 | U Missouri | NR | N/A | 44.39 |
Let's put it simply:
What happened last year?

Class of 2020
Total Law Grads: 34,420
- Real Lawyer Jobs*
- 69.9%
- Other
- 20.4%
- Unemployed/Seeking
- 8.3%
- Law School-Funded Positions
- 1.4%
This means 30.1% of 2020 graduates did not secure a job in the law!
Methodology
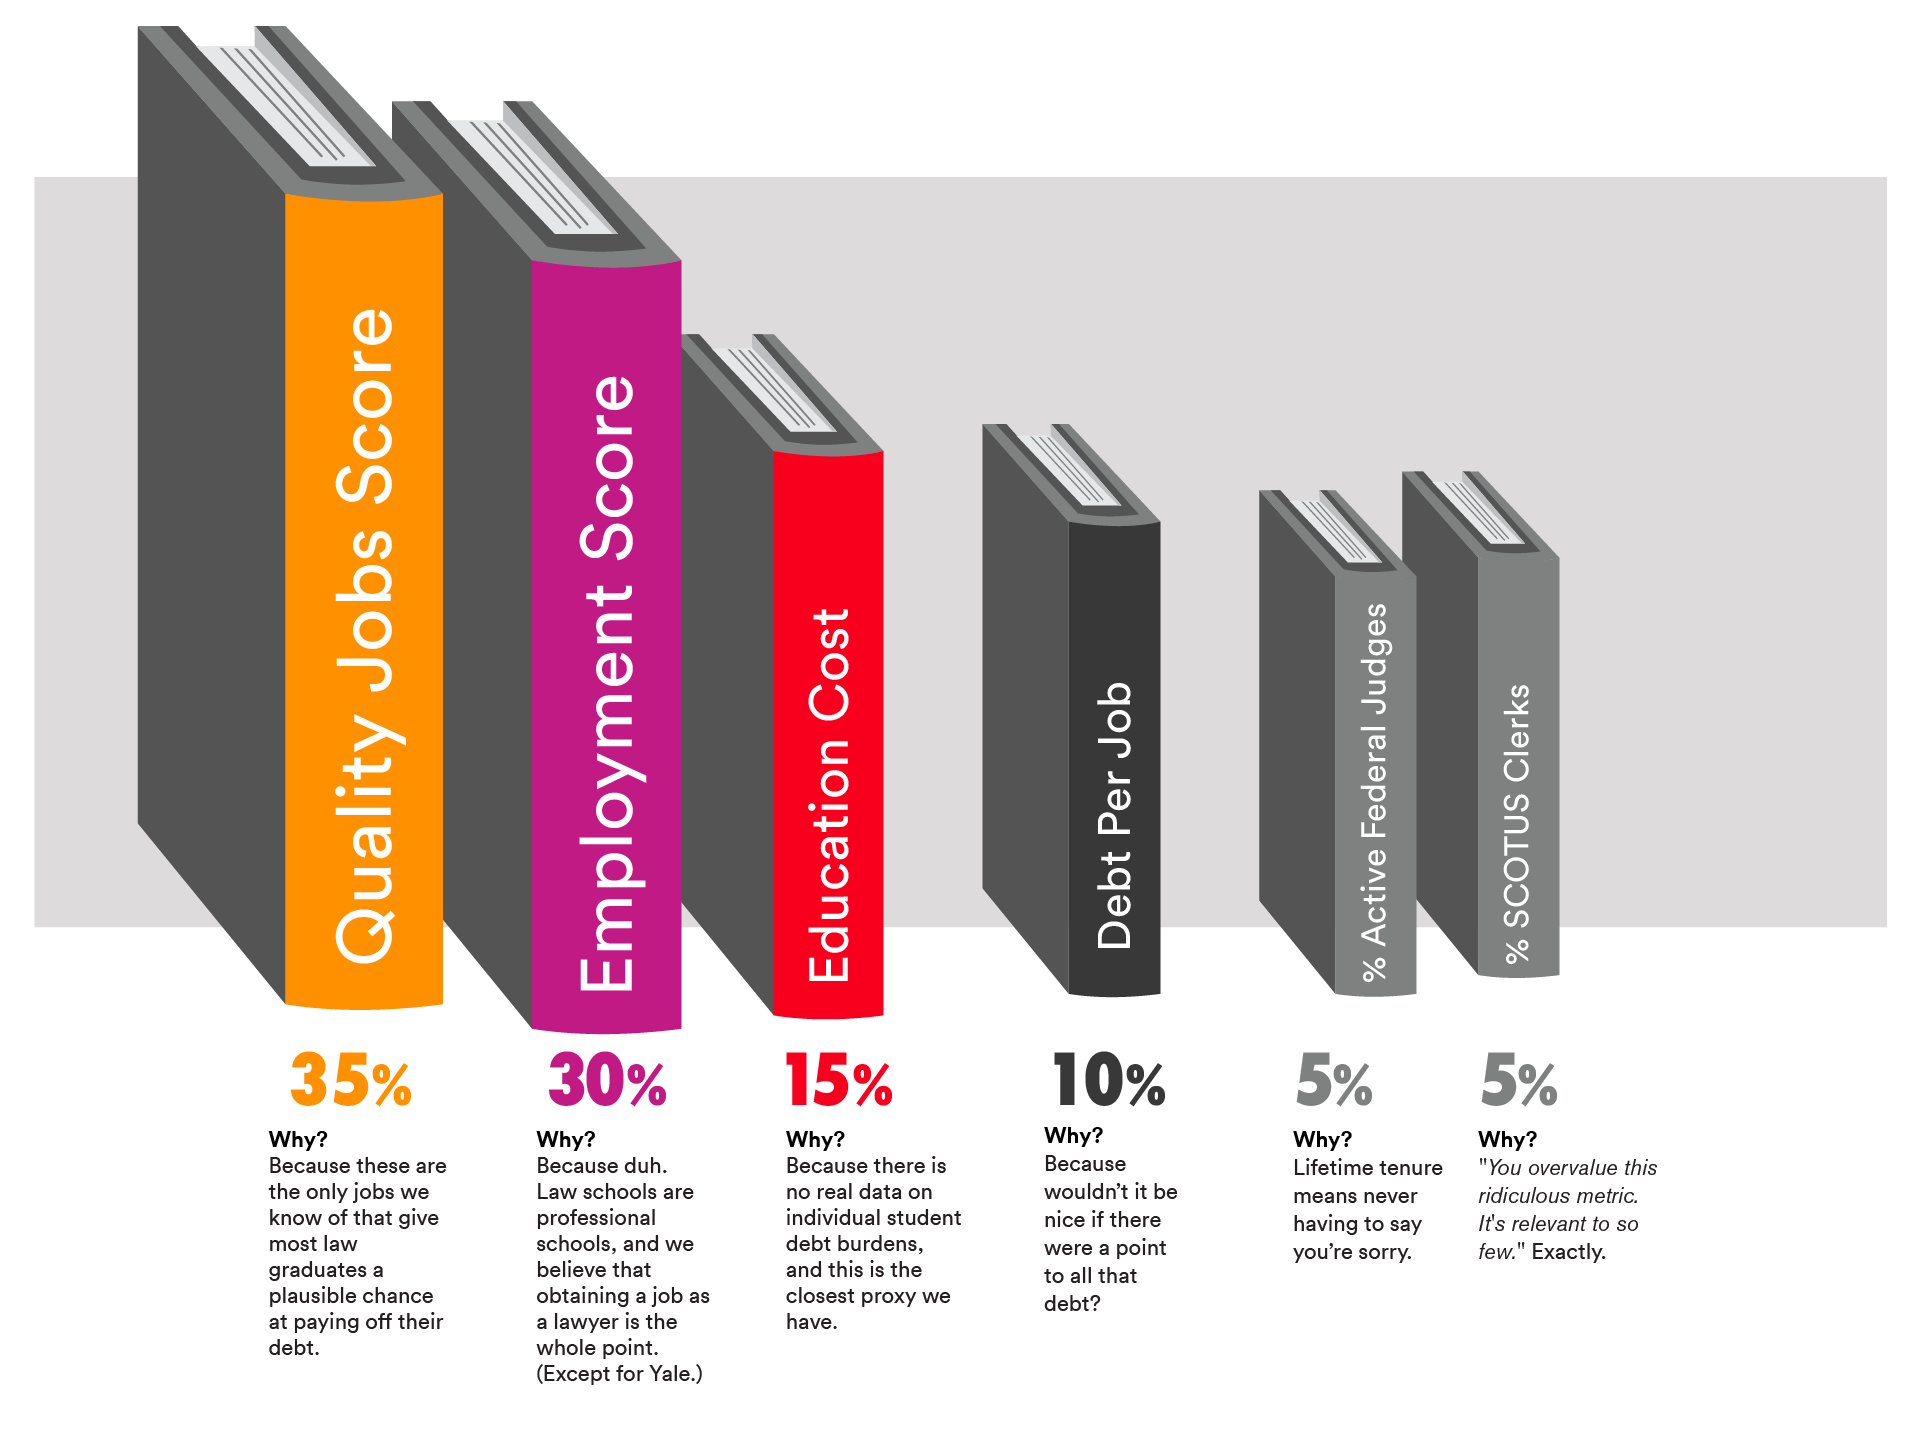
We prioritize employment outcomes above all else in comparing law schools. Therefore, these are the components of our rankings methodology:
Some further notes on methodology
Quality jobs score (35%)
This measures the schools’ success at placing students on career paths that best enable them to pay off their student debts. We’ve combined placement with the country’s largest and best-paying law firms and the percentage of graduates embarking on federal judicial clerkships. These clerkships typically lead to a broader and enhanced range of employment opportunities.
Employment score (30%)
We only counted full-time, long-term jobs requiring bar passage (excluding solos and school-funded positions). Look, we know that there are some great non-lawyer jobs out there for which a J.D. is an “advantage.” It's not as if these jobs don't count, it's that they can't be compared in a meaningful way. The definition of "J.D. Advantage" changes from year to year and is based on a self-reported metric that defies independent third-party verification. One school's apples are another school's oranges, but we're not going to count lemons. (Early access to data courtesy of Law School Transparency.)
Education cost (15%)
Solid data on individual law student educational debt is hard to come by. Published averages exist, but the crucial number,the amount of non-dischargeable, government-funded or guaranteed educational loan debt, is not available. So as a proxy for indebtedness, we’ve scored schools based on total cost. (Data courtesy of Law School Transparency.)
Debt-per-job ratio (10%)
This is a comparison between the indebtedness of a school’s graduates to the number of actual legal jobs they obtain.
SCOTUS clerk & Federal judgeship scores (5% each)
Though obviously applicable to very different stages of legal careers, these two categories represent the pinnacles of the profession. For the purposes of these rankings, we simply looked at a school's graduates as a percentage of (1) all U.S. Supreme Court clerks (since 2013) and (2) currently sitting Article III judges. Both scores are adjusted for the size of the school. Obviously, we are aware that for the vast majority of students, Supreme Court clerkships or the federal bench are simply not prospects. But for the students who do want to be judges and academics, this outcome represents a useful separating factor for the most elite schools. Some schools put you in robes, others can't.