Most people attend law school to obtain jobs as lawyers.
(Law school enrollment is rebounding, hopefully all the new applicants are focused on employment outcomes too.)
The stock market is booming. Those gains haven’t exactly trickled down to the workaday schlubs on Main Street, but going to a top law school is supposed to buy you out of that Main Street nonsense anyway. What we do know is that when publicly traded companies have a lot of money, they have enough money to pay their legal bills. If business is good for clients, it’s great for law firms.
So, who are law firms hiring? Hiring levels may never again reach pre-recession heights, but there are a lot of good, $180,000 jobs out there for those who go to the “right” law schools. This ranking focuses on the employment outcomes of the right law schools. If the market is making it rain, we’re looking at the schools with the biggest buckets.
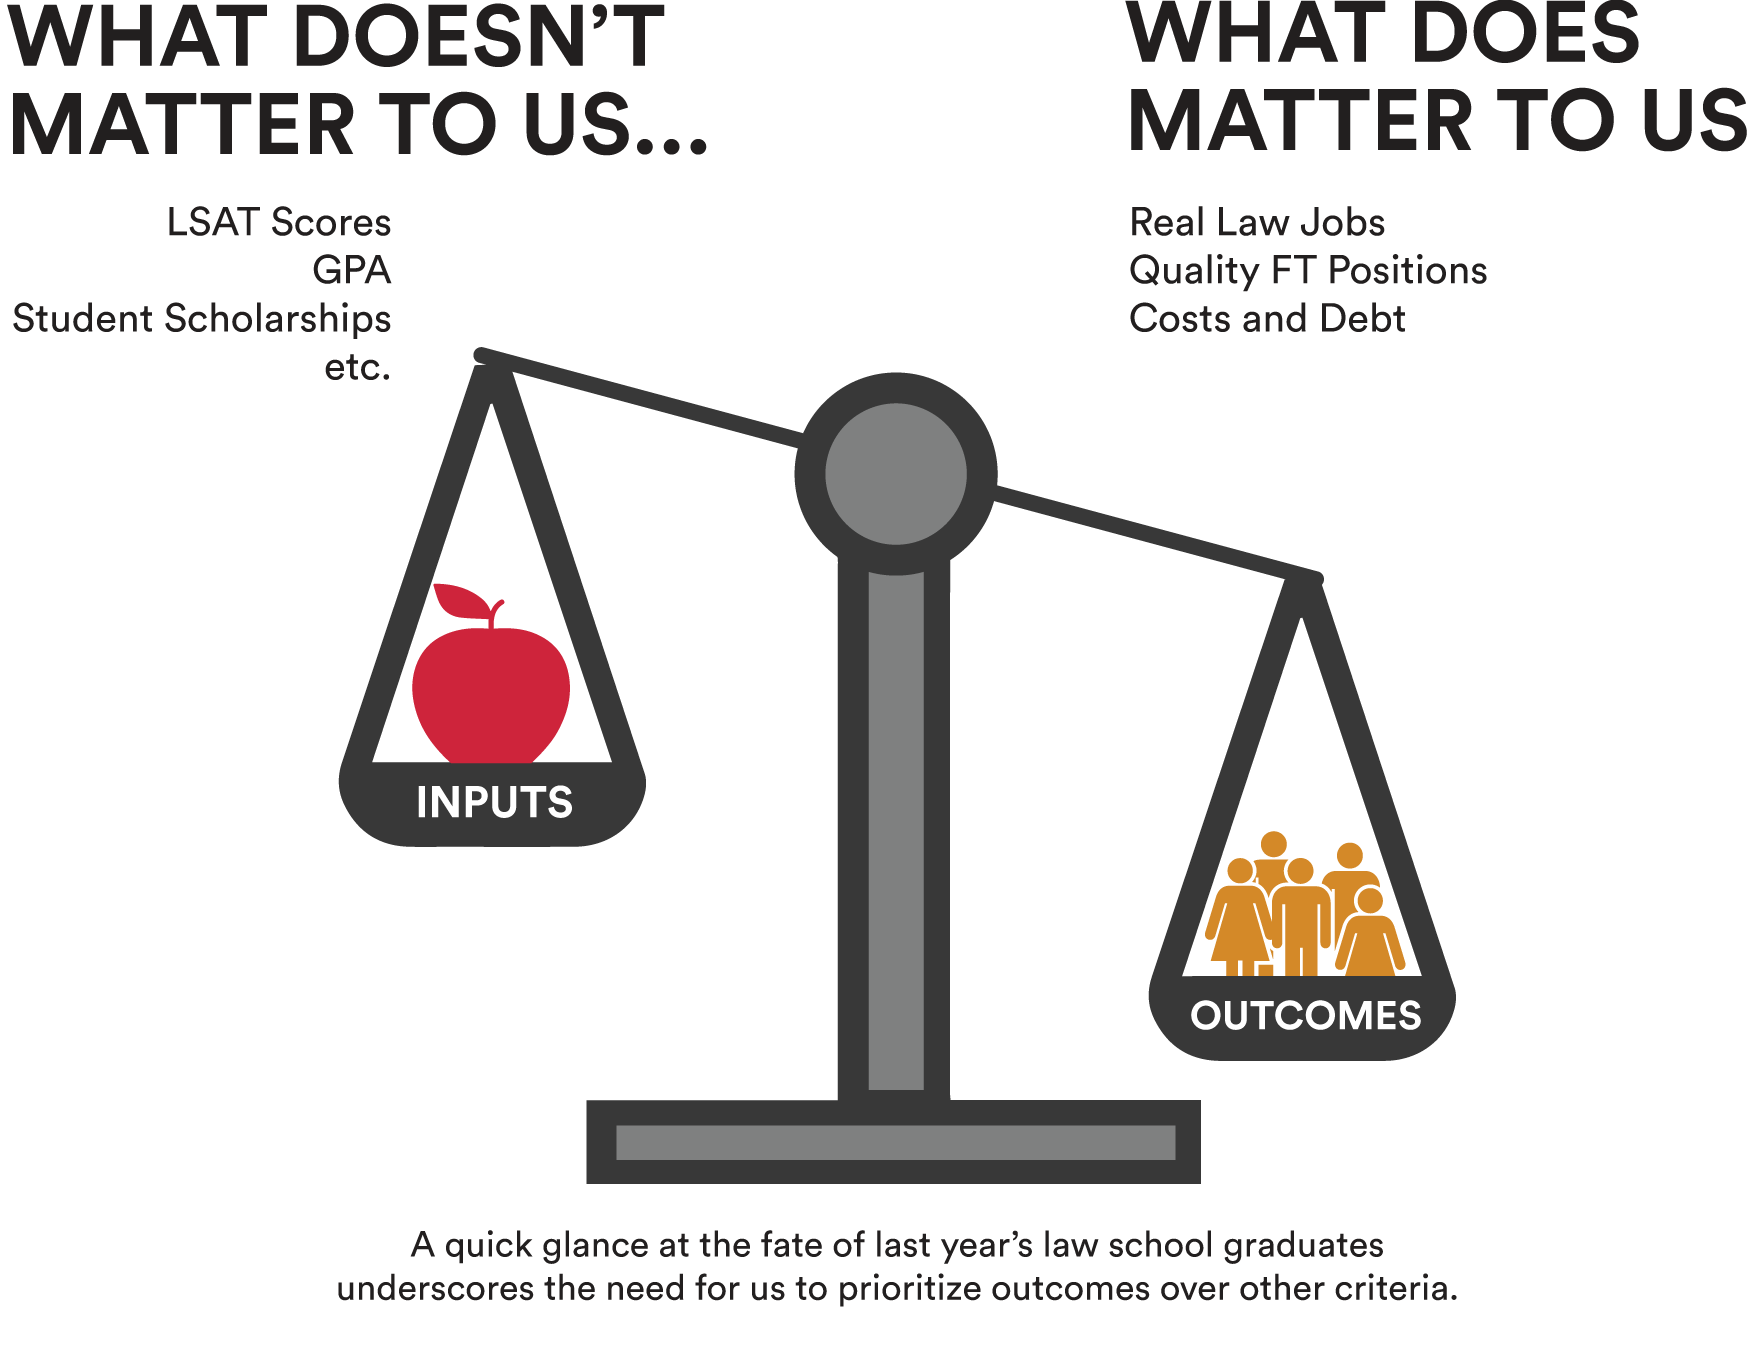
We welcome you to the sixth annual installment of the Above the Law Top 50 Law School Rankings. These are the only rankings to incorporate the latest ABA employment data concerning the class of 2017. The premise underlying our approach to ranking schools remains the same: Given the steep cost of law school and the harsh realities of the legal job market, potential students should prioritize their future employment prospects over all other factors in deciding whether and where to attend law school. The relative quality of schools is a function of how they deliver on the promise of gainful legal employment.
Our list is limited to 50 schools. We want to look at “national” schools, the ones with quality employment prospects outside of their particular region and/or for students who don’t graduate at the top of the class.
The ATL Top 50 Law School Rankings keep an exclusive focus on the only thing that really matters: outcomes.
Enjoy the rankings, but please use them responsibly.
![]()
Is the LSAT Required for Law School?
- If you’re applying within the next year, you’re almost certainly going to need to take and do well on the LSAT. With the number of applicants up nearly 9 percent this cycle, competition is heating up
- If you’re applying in 2019 or beyond, you may have choices as to which admission test you can take, but you’ll probably still need to take a test, and you should probably take the LSAT…unless every school you’re applying to accepts the GRE.
The Rankings
See the 2017 rankings →How do law schools fare when assessed using this outcomes-based methodology?
| 2018 Rank | School | 2017 Rank | Change | Score |
|---|---|---|---|---|
| 1 | University of Chicago | 2 | 1 | 86.37 |
| 2 | Virginia | 6 | 4 | 81.2 |
| 3 | Duke | 4 | 1 | 80.79 |
| 4 | Harvard | 5 | 1 | 79.48 |
| 5 | Stanford | 1 | -4 | 77.5 |
| 6 | University of Pennsylvania | 7 | 1 | 77.42 |
| 7 | Yale | 3 | -4 | 76.52 |
| 8 | Michigan | 13 | 5 | 74.82 |
| 9 | Cornell | 8 | -1 | 73.8 |
| 10 | Northwestern | 9 | -1 | 73.15 |
| 11 | UC Berkeley | 12 | 1 | 71.58 |
| 12 | Vanderbilt | 11 | -1 | 71.04 |
| 13 | Columbia | 10 | -3 | 70.87 |
| 14 | NYU | 15 | 1 | 65.19 |
| 15 | University of Texas | 14 | -1 | 64.28 |
| 16 | Georgetown | 18 | 2 | 62.42 |
| 17 | Washington University in St. Louis Law | 17 | NC | 62.02 |
| 18 | University of Notre Dame | 20 | 2 | 60.51 |
| 19 | University of Southern California, Gould | NR | NR | 59.36 |
| 20 | Boston College | 16 | -4 | 59.2 |
| 21 | University of Georgia | 19 | -2 | 59 |
| 22 | University of Alabama Law | 29 | 7 | 58.49 |
| 23 | UCLA | 25 | 2 | 58.01 |
| 24 | Boston University | 30 | 6 | 56.43 |
| 25 | University of Illinois | 22 | -3 | 56.34 |
| 26 | University of Iowa | 26 | NC | 56.18 |
| 27 | William & Mary Law | 41 | 14 | 55.48 |
| 28 | Temple University Beasley School of Law | 37 | 9 | 54.66 |
| 29 | Ohio State University Moritz College of Law | 23 | -6 | 54.31 |
| 30 | Washington and Lee | 21 | -9 | 54.16 |
| 31 | University of North Carolina | 28 | -3 | 53.87 |
| 32 | University of Minnesota | 31 | -1 | 53.66 |
| 33 | Baylor Law School | 40 | 7 | 52.72 |
| 34 | SMU Dedman School of Law | 32 | -2 | 52.34 |
| 35 | Seton Hall | 24 | -11 | 52.26 |
| 36 | University of Florida - Levin | 34 | -2 | 52.05 |
| 37 | University of Tulsa | NR | NR | 52.03 |
| 38 | Wake Forest University School of Law | 49 | 11 | 51.36 |
| 39 | Villanova | 45 | 6 | 50.91 |
| 40 | Louisiana State University | NR | NR | 50.47 |
| 41 | Emory | 50 | 9 | 50.43 |
| 42 | University of Wisconsin Law School | 42 | NC | 50.07 |
| 43 | University of Missouri School of Law | NR | NR | 49.66 |
| 44 | George Washington | 34 | -10 | 49.21 |
| 45 | University of New Mexico | 47 | 2 | 48.8 |
| 46 | Georgia State | 33 | -13 | 48.5 |
| 47 | Saint Louis University Law | NR | NR | 48.38 |
| 48 | University of New Hampshire | NR | NR | 48.03 |
| 49 | Arizona State University, Sandra Day O'Connor College of Law | NR | NR | 47.94 |
| 50 | University of Utah, S.J. Quinney College of Law | NR | NR | 47.52 |
Let's put it simply:
What happened last year?
The Class of 2017
Total Law Grads: 34,923
Methodology
We prioritize employment outcomes above all else in comparing law schools. Therefore, these are the components of our rankings methodology:

Some further notes on methodology
Employment score (30%)
We only counted full-time, long-term jobs requiring bar passage (excluding solos and school-funded positions). Look, we know that there are some great non-lawyer jobs out there for which a J.D. is an “advantage.” It’s not as if these jobs don’t count, it’s that they can’t be compared in a meaningful way. The definition of “J.D. Advantage” changes from year to year and is based on a self-reported metric that defies independent third-party verification. One school’s apples are another school’s oranges, but we’re not going to count lemons.
Quality jobs score (30%)
This measures the schools’ success at placing students on career paths that best enable them to pay off their student debts. We’ve combined placement with the country’s largest and best-paying law firms and the percentage of graduates embarking on federal judicial clerkships. These clerkships typically lead to a broader and enhanced range of employment opportunities.
Education cost (15%)
Solid data on individual law student educational debt is hard to come by. Published averages exist, but the crucial number, the amount of non-dischargeable, government-funded or guaranteed educational loan debt, is not available. So as a proxy for indebtedness, we’ve scored schools based on total cost. (Data courtesy of Law School Transparency.)
SCOTUS clerk & Federal judgeship scores (5% each)
Though obviously applicable to very different stages of legal careers, these two categories represent the pinnacles of the profession. For the purposes of these rankings, we simply looked at a school’s graduates as a percentage of (1) all U.S. Supreme Court clerks (since 2011) and (2) currently sitting Article III judges. Both scores are adjusted for the size of the school. Obviously, we are aware that for the vast majority of students, Supreme Court clerkships or the federal bench are simply not prospects. But for the students who do want to be judges and academics, this outcome represents a useful separating factor for the most elite schools. Some schools put you in robes, others can’t.
ATL Alumni rating (5%)
This is the only non-public component of our rankings. Our ATL Insider Survey asks students and alumni to rate their schools in terms of academics, financial aid advising, career services advising, social life, and clinical training. For the purposes of the ATL Top 50, we only counted the alumni ratings, as that was more in keeping with our “outcomes only” approach.
Debt-per-job ratio (10%)
This is a comparison between the indebtedness of a school’s graduates to the number of actual legal jobs they obtain.