
Most people attend law school to obtain jobs as lawyers.
(If you want to go to law school, you’re probably going to want a job when it’s over.)
People these days are going to law school for so many good reasons. So many new law students are there because they want to “help”: they want to serve their community, or advocate their issues, or even defend the country. The feeling that good, honorable, and ethical lawyers are necessary for a well functioning Democracy is more alive now than ever before.
Of course, good intentions plus two dollars will buy you a soda. Enrollment is up at law schools, but the cost is not coming down. Even the very best of intentions rarely survive unemployment and crushing debt.
Which law schools are putting their graduates in a position to get jobs? And which ones are leaving their students with little more than a diploma and a dream?
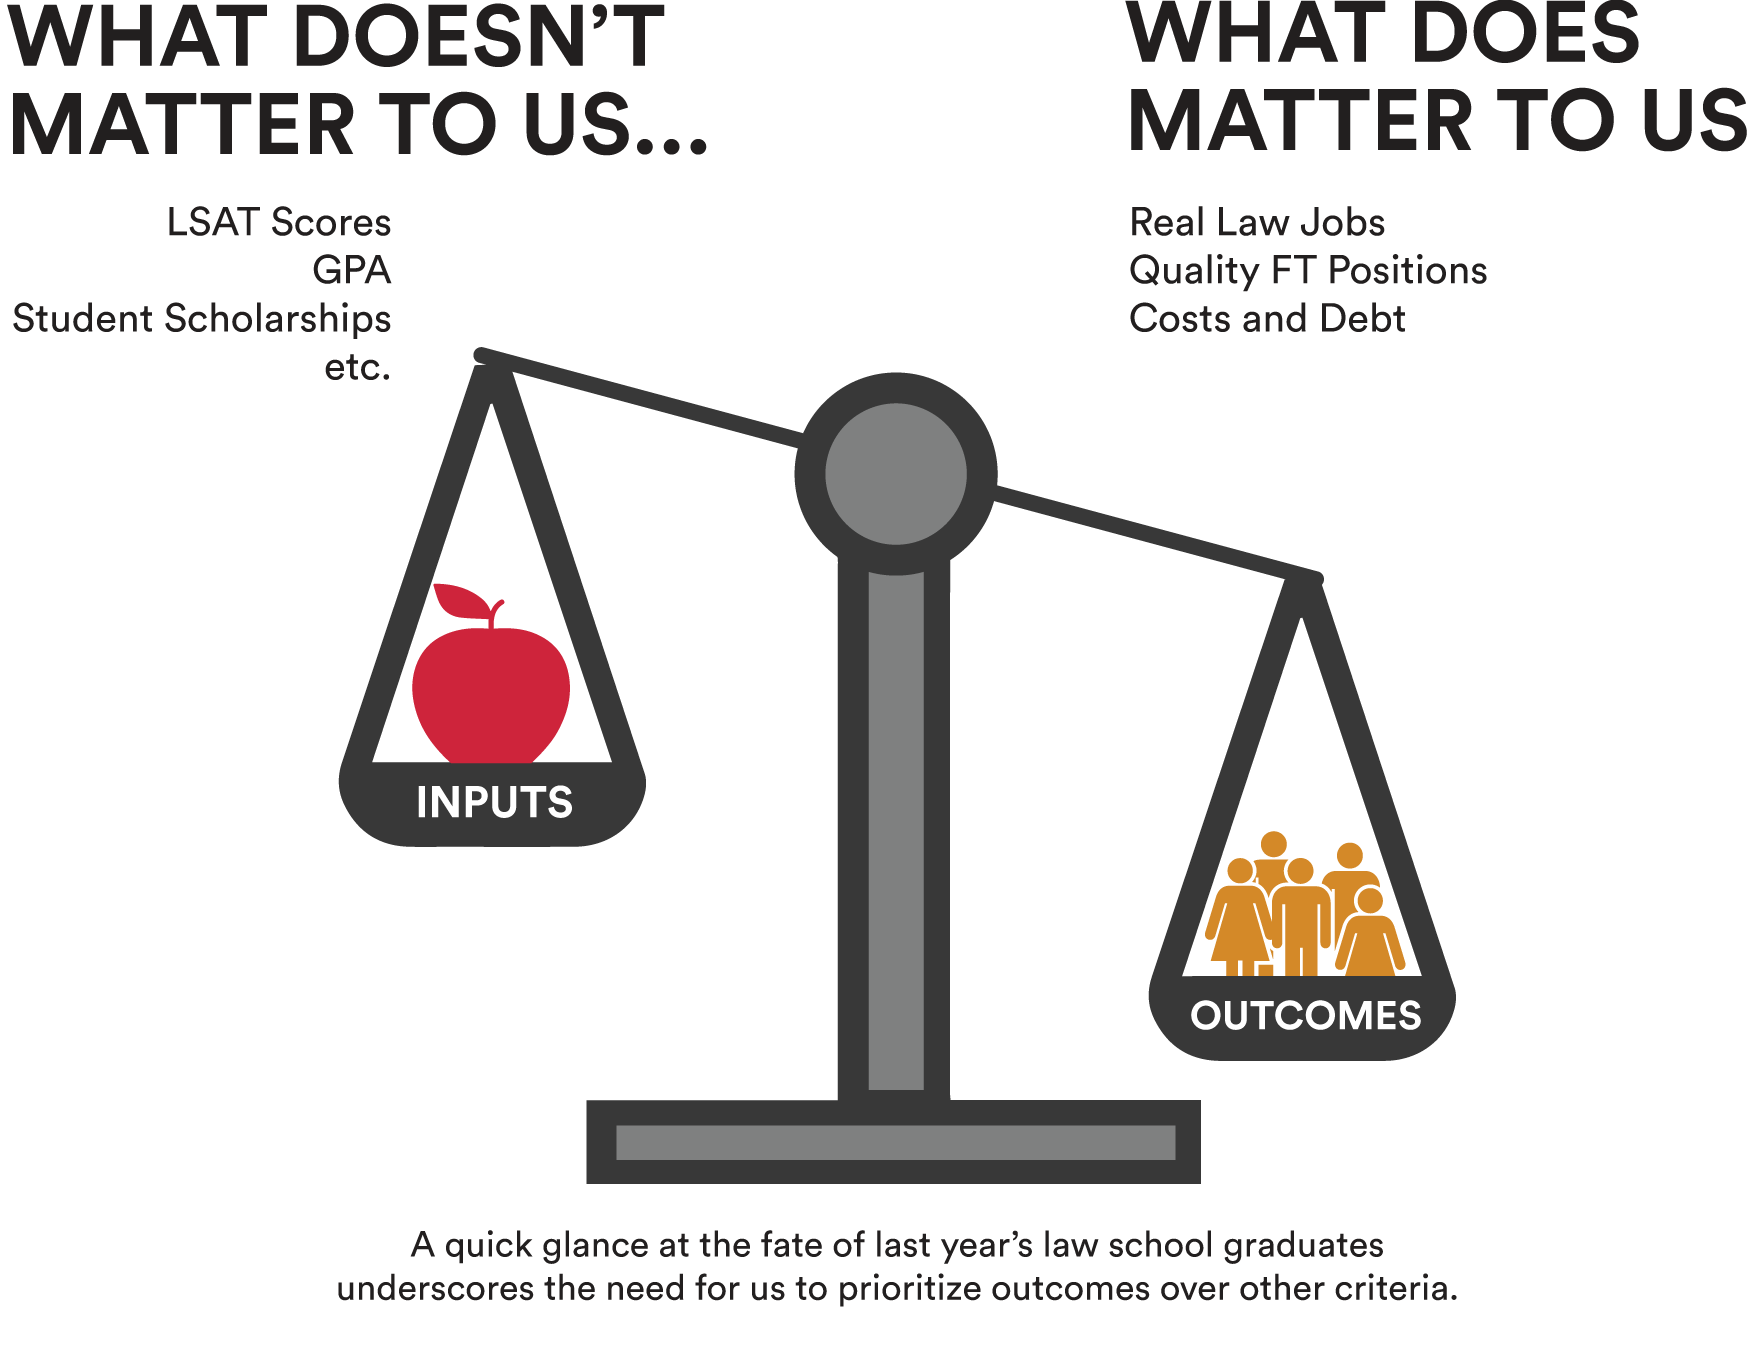
We welcome you to the seventh annual installment of the Above the Law Top 50 Law School Rankings. These are the only rankings to incorporate the latest ABA employment data concerning the class of 2018. The premise underlying our approach to ranking the top law schools in America remains the same: Given the steep cost of law school and the harsh realities of the legal job market, potential students should prioritize their future employment prospects over all other factors in deciding whether and where to attend law school. The relative quality of schools is a function of how they deliver on the promise of gainful legal employment.
Our list is limited to 50 schools. We want to look at “national” schools, the ones with quality employment prospects both outside of their particular region and/or for graduates who don’t graduate at the top of the class.
The ATL Top 50 Law School Rankings keep an exclusive focus on the only thing that really matters: outcomes.
Enjoy the rankings, but please use them responsibly.

Download A Survivor’s Guide to Law School
Learn some tips and tricks from pros who know.
A Survivor’s Guide to Law School includes:
- Tips to get the most out of Career Services and your professors’ office hours
- Advice on choosing extracurriculars—and knowing the ones to avoid
- How to avoid the stress of exam prep
- Are you a “gunner”? Find out!
The Rankings
See the 2018 rankings →How do law schools fare when assessed using this outcomes-based methodology?
| 2019 Rank | School | 2018 Rank | Change | Score |
|---|---|---|---|---|
| 1 | University of Virginia | 2 | 75.97 | |
| 2 | Duke University | 3 | 73.61 | |
| 3 | University of Chicago | 1 | 71.58 | |
| 4 | Northwestern University | 10 | 71.2 | |
| 5 | Cornell University | 9 | 69.64 | |
| 6 | Stanford University | 5 | 69.45 | |
| 7 | University of Pennsylvania | 6 | 69.3 | |
| 8 | University of Michigan - Ann Arbor | 8 | 68.49 | |
| 9 | Harvard University | 4 | 67.19 | |
| 10 | Yale University | 7 | 66.4 | |
| 11 | Columbia University | 13 | 66.17 | |
| 12 | University of Texas at Austin | 15 | 66.04 | |
| 13 | Vanderbilt University | 12 | 63.51 | |
| 14 | UC Berkeley | 11 | 63.03 | |
| 15 | Washington University in St. Louis | 17 | 62.82 | |
| 16 | NYU | 14 | 60.16 | |
| 17 | University of North Carolina Chapel Hill | 31 | 55.85 | |
| 18 | Georgetown University | 16 | 55.73 | |
| 19 | University of Georgia | 21 | 55.21 | |
| 20 | University of Notre Dame | 18 | 55.07 | |
| 21 | University of Iowa | 26 | 54.42 | |
| 22 | Washington and Lee University | 30 | 53.87 | |
| 23 | University of Kentucky | NR | 53.07 | |
| 24 | William and Mary Law School | 27 | 51.75 | |
| 25 | University of Illinois Urbana Champaign | 25 | 51.58 | |
| 26 | Ohio State University | 29 | 51.16 | |
| 27 | Boston University | 24 | 50.76 | |
| 28 | UCLA | 23 | 49.66 | |
| 29 | University of Minnesota | 32 | 48.61 | |
| 30 | University of Florida | 36 | 48.56 | |
| 31 | Boston College | 20 | 48.12 | |
| 32 | Fordham University | 68 | 48 | |
| 33 | Brigham Young University | NR | 47.01 | |
| 34 | Emory University | 41 | 46.62 | |
| 35 | Seton Hall University | 35 | 46.05 | |
| 36 | University of Nebraska Lincoln | NR | 45.67 | |
| 37 | University of Wisconsin Madison | 42 | 45.45 | |
| 38 | Penn State Carlisle | 75 | 45.44 | |
| 39 | University of Houston | 52 | 44.97 | |
| 40 | Indiana University Bloomington | 62 | 44.96 | |
| 41 | Rutgers | 92 | 44.82 | |
| 42 | Georgia State University | 46 | 44.8 | |
| 43 | Temple University | 28 | 44.68 | |
| 44 | University of Oklahoma | NR | 44.24 | |
| 45 | Villanova University | 39 | 44.18 | |
| 46 | University of Alabama | 22 | 44.01 | |
| 47 | Florida State University | 51 | 42.89 | |
| 48 | USC (Gould) | 19 | 42.88 | |
| 49 | Southern Methodist University | 34 | 42.86 | |
| 50 | University of Colorado Boulder | NR | 42.81 |
Let's put it simply:
What happened last year?
The Class of 2018
Total Law Grads: 34,221
Methodology
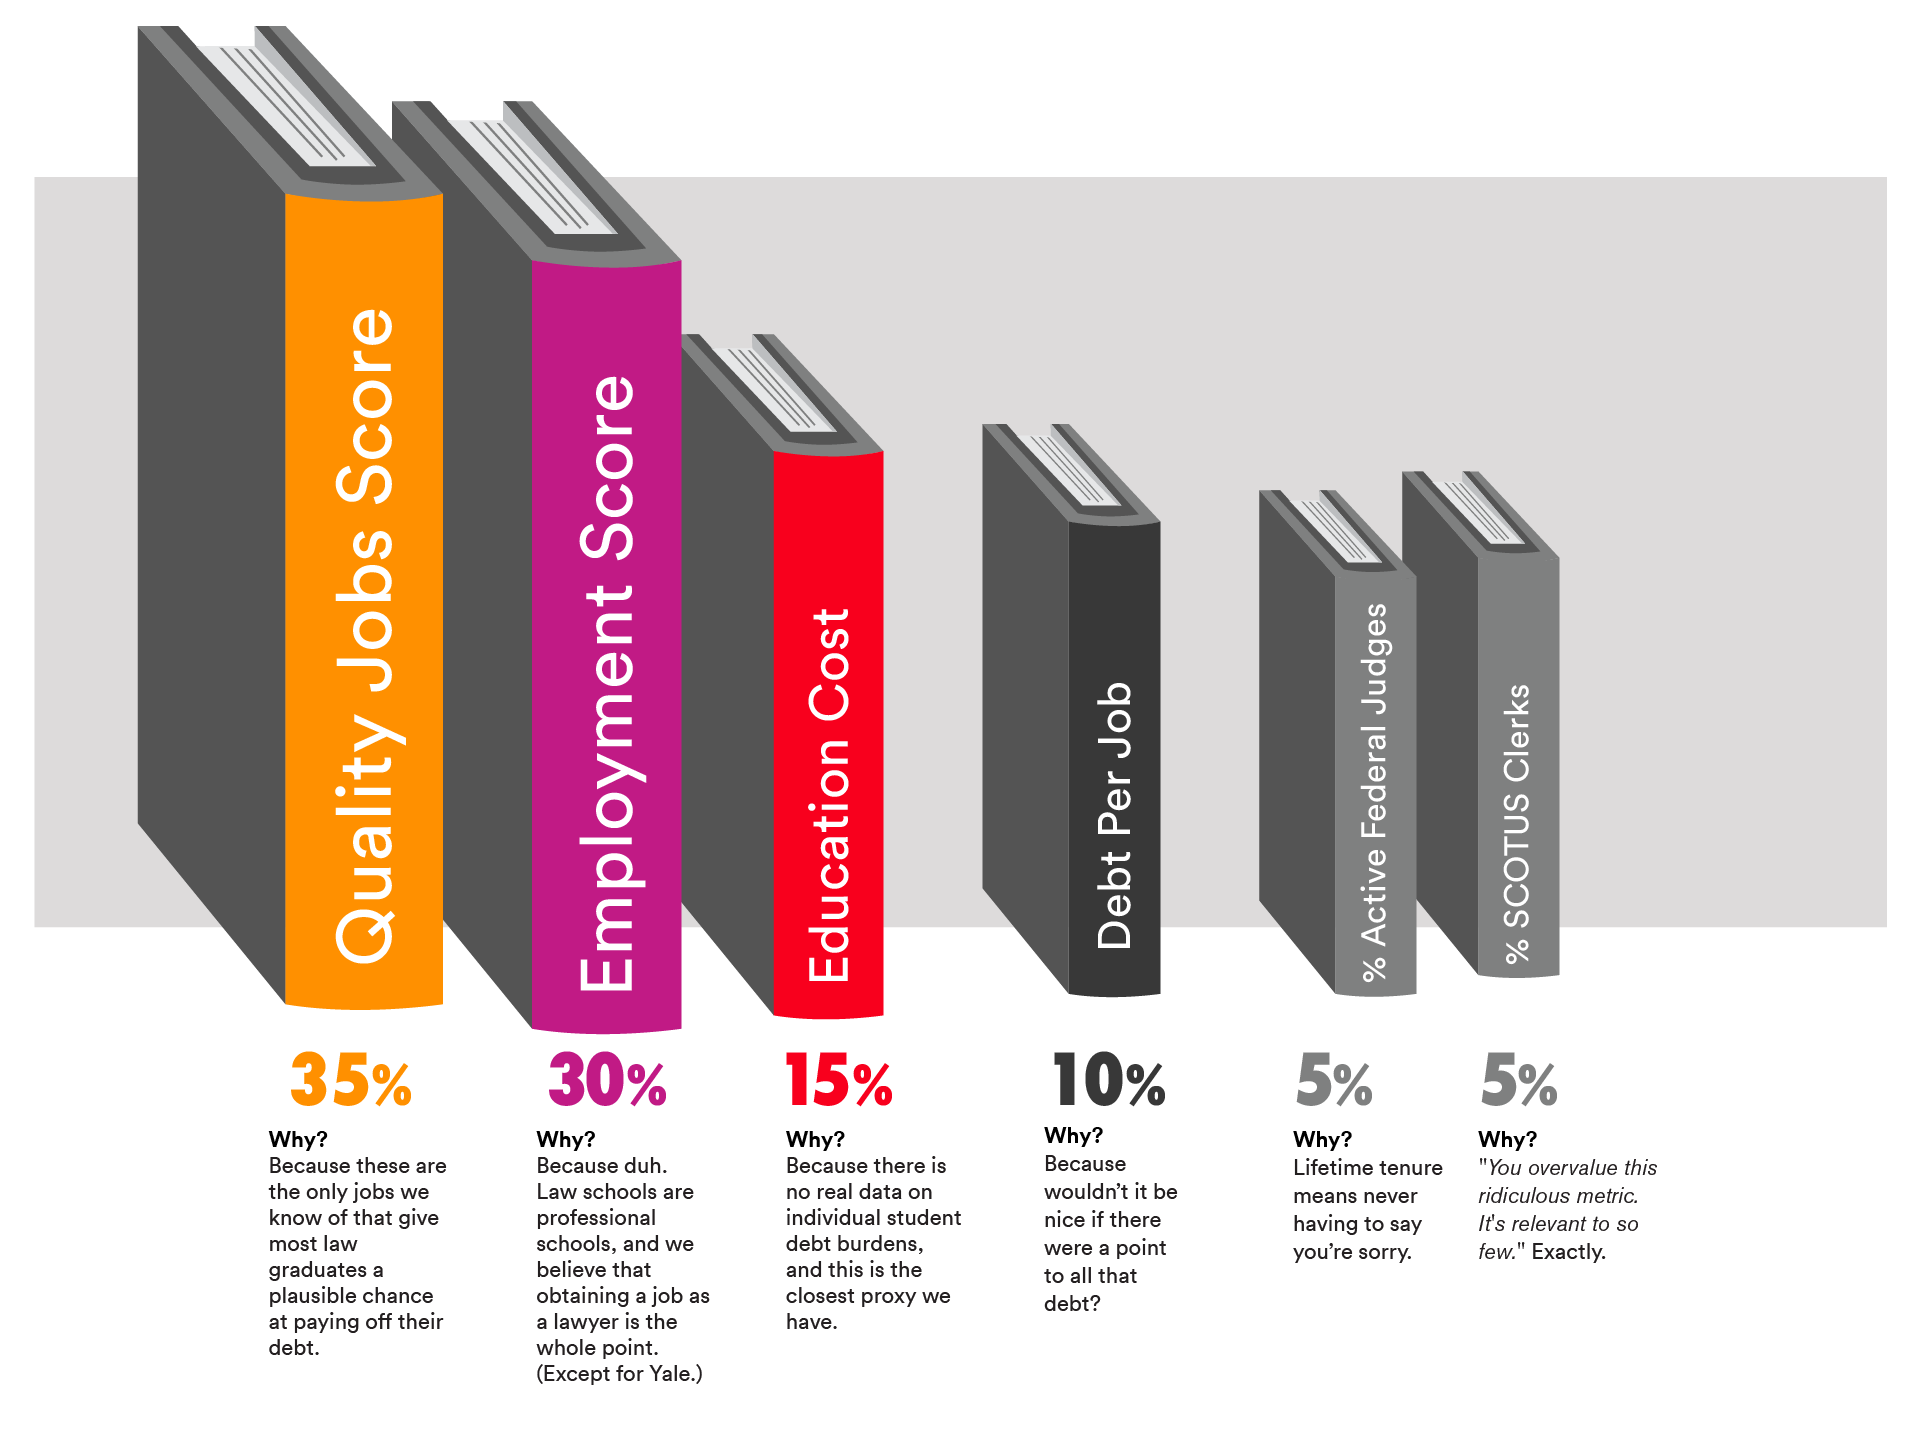
We prioritize employment outcomes above all else in comparing law schools. Therefore, these are the components of our rankings methodology:
Some further notes on methodology
Quality jobs score (35%)
This measures the schools’ success at placing students on career paths that best enable them to pay off their student debts. We’ve combined placement with the country’s largest and best-paying law firms and the percentage of graduates embarking on federal judicial clerkships. These clerkships typically lead to a broader and enhanced range of employment opportunities.
Employment score (30%)
We only counted full-time, long-term jobs requiring bar passage (excluding solos and school-funded positions). Look, we know that there are some great non-lawyer jobs out there for which a J.D. is an “advantage.” It’s not as if these jobs don’t count, it’s that they can’t be compared in a meaningful way. The definition of “J.D. Advantage” changes from year to year and is based on a self-reported metric that defies independent third-party verification. One school’s apples are another school’s oranges, but we’re not going to count lemons. (Early access to data courtesy of Law School Transparency.)
Education cost (15%)
Solid data on individual law student educational debt is hard to come by. Published averages exist, but the crucial number,the amount of non-dischargeable, government-funded or guaranteed educational loan debt, is not available. So as a proxy for indebtedness, we’ve scored schools based on total cost. (Data courtesy of Law School Transparency.)
SCOTUS clerk & Federal judgeship scores (5% each)
Though obviously applicable to very different stages of legal careers, these two categories represent the pinnacles of the profession. For the purposes of these rankings, we simply looked at a school’s graduates as a percentage of (1) all U.S. Supreme Court clerks (since 2012) and (2) currently sitting Article III judges. Both scores are adjusted for the size of the school. Obviously, we are aware that for the vast majority of students, Supreme Court clerkships or the federal bench are simply not prospects. But for the students who do want to be judges and academics, this outcome represents a useful separating factor for the most elite schools. Some schools put you in robes, others can’t.