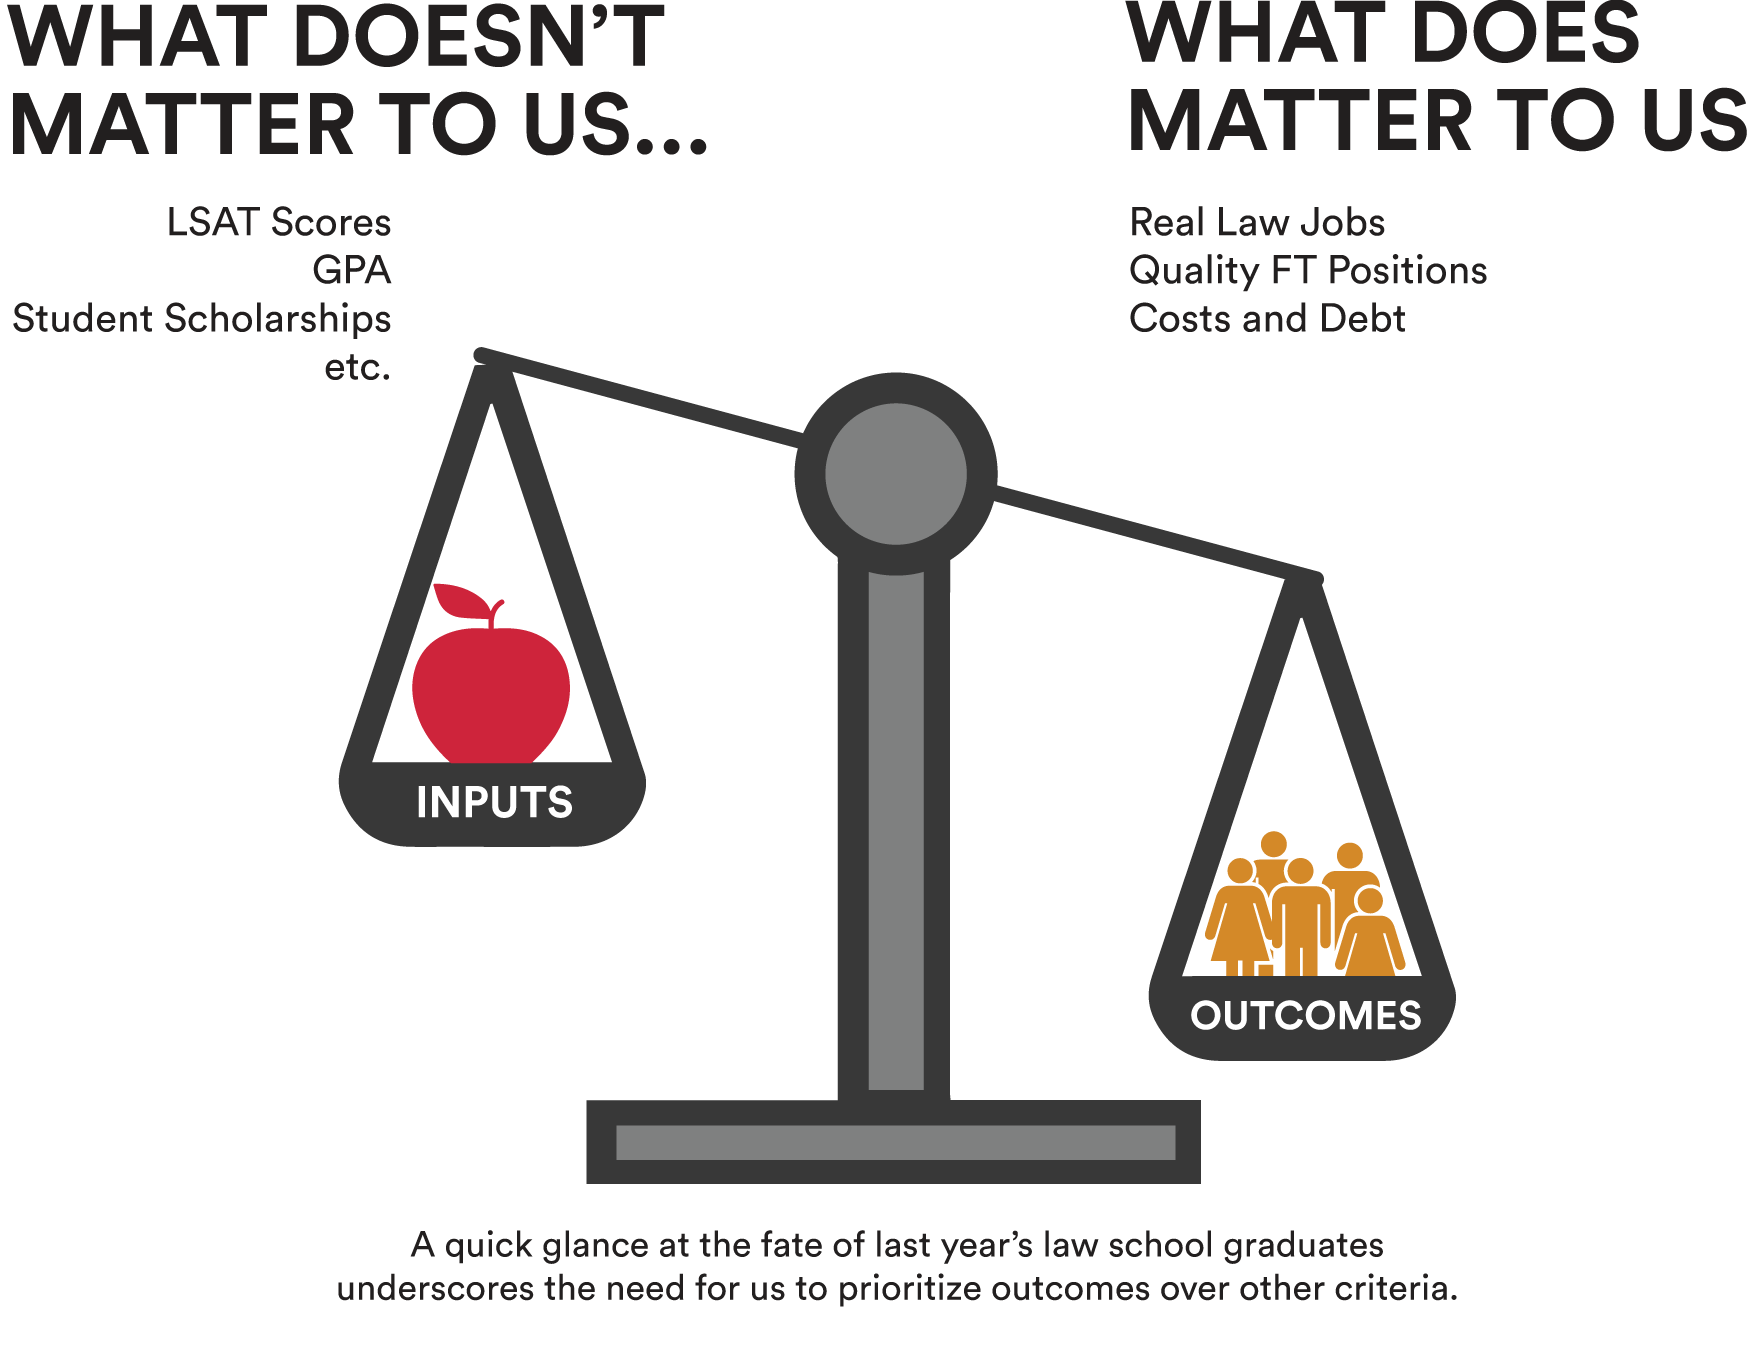
Most people attend law school to obtain jobs as lawyers, or at least they should.
Law school student loans are real, and they are huge, so you’d best have a plan to pay them off on the back end of your J.D. Even if you are among the lucky few who can afford a legal education without taking on debt, the return on that tremendous investment of time and money should include the likelihood of landing a real job as a lawyer. That’s why we make employment the primary factor in our law school ranking. Check out our list for the law schools that put their graduates in the best position to get jobs.
Welcome to the 12th annual edition of the Above the Law Top 50 Law School Rankings. These are the only rankings to incorporate the latest ABA employment data concerning the class of 2023. Despite a modification in our formula this year, the premise underlying our approach to ranking schools remains the same as ever: Given the steep cost of law school and the harsh realities of the legal job market, potential students should prioritize their future employment prospects over all other factors in deciding whether and where to attend law school. The relative quality of schools is a function of how they deliver on the promise of gainful legal employment.
While we analyzed data for all 195 ABA-approved schools, our ranking is limited to the top 50. We want to focus on “national” schools, the ones with quality employment prospects both outside of their particular region and/or for graduates who don’t graduate at the top of the class.
Changes to this year’s ranking criteria include the removal of debt as a separate factor—though cost continues to play a role—and the addition of first-time bar passage rate. As always, the ATL Top 50 Law School Rankings prioritize the one thing that really matters: outcomes.
 For those with different priorities, check out the new ATL Law School DIY where you can adjust the relative weights of 12 factors yourself to customize rankings based on your personal needs and goals.
![]()
Raising The Bar in Bar Prep
Themis Bar Review offers a comprehensive suite of legal education products and resources for students and law schools.
Themis is committed to students’ success in law school, the bar exam, and beyond.
Thousands of students have trusted Themis for its proven methodology and its first-in-class Bar Review course that consistently delivers high pass rates.
The Rankings
See the 2023 rankings →How do law schools fare when assessed using this outcomes-based methodology?
| 2024 Rank | School | 2023 Rank | Change | Score |
|---|---|---|---|---|
| 1 | U Virginia | 3 | 2 | 85.58 |
| 2 | U Chicago | 4 | 2 | 85.36 |
| 3 | Duke | 1 | -2 | 81.03 |
| 4 | U Michigan | 5 | 1 | 80.67 |
| 5 | Columbia | 6 | 1 | 79 |
| 6 | U Penn (Carey) | 9 | 3 | 78.72 |
| 7 | Cornell | 2 | -5 | 78.5 |
| 8 | Northwestern (Pritzker) | 8 | 0 | 78.03 |
| 9 | U Notre Dame | 10 | 1 | 76.44 |
| 10 | Vanderbilt | 7 | -3 | 76.31 |
| 11 | Harvard | 14 | 3 | 75.26 |
| 12 | Washington U in St. Louis | 11 | -1 | 75.17 |
| 13 | Yale | 16 | 3 | 73.88 |
| 14 | U Texas at Austin | 13 | -1 | 71.71 |
| 15 | Stanford | 27 | 12 | 70.87 |
| 16 | Boston College | 26 | 10 | 70.2 |
| 17 | USC (Gould) | 17 | 0 | 69.82 |
| 18 | Georgetown | 24 | 6 | 69.27 |
| 19 | NYU | 12 | -7 | 68.74 |
| 20 | Howard | 33 | 13 | 67.58 |
| 21 | UCLA | 22 | 1 | 67.16 |
| 22 | U Florida (Levin) | 31 | 9 | 67.03 |
| 23 | Boston U | 30 | 7 | 67 |
| 24 | Emory | 32 | 8 | 66.71 |
| 25 | UC Berkeley | 20 | -5 | 65.65 |
| 26 | Fordham | 23 | -3 | 65.49 |
| 27 | U Georgia | 15 | -12 | 64.92 |
| 28 | Washington and Lee | 18 | -10 | 64.5 |
| 29 | U Alabama | 21 | -8 | 64.31 |
| 30 | UC Irvine | NR | N/A | 64.23 |
| 31 | UNC | 29 | -2 | 63.28 |
| 32 | Wake Forest | 36 | 4 | 63.17 |
| 33 | U Iowa | 28 | -5 | 62.09 |
| 34 | SMU (Dedman) | 38 | 4 | 61.05 |
| 35 | William and Mary | 45 | 10 | 60.27 |
| 36 | U Houston | NR | N/A | 59.68 |
| 37 | George Washington | NR | N/A | 59.62 |
| 37 | U Minnesota | 34 | -3 | 59.62 |
| 39 | Baylor | NR | N/A | 58.85 |
| 40 | Villanova | 47 | 7 | 58.43 |
| 41 | Ohio State (Moritz) | 40 | -1 | 58.27 |
| 42 | Brigham Young | 42 | 0 | 57.99 |
| 43 | Florida State | 41 | -2 | 57.05 |
| 44 | U Illinois Urbana-Champaign | 19 | -25 | 56.78 |
| 45 | Tulane | NR | N/A | 56.61 |
| 46 | Temple | NR | N/A | 55.44 |
| 47 | West Virginia | NR | N/A | 55.28 |
| 48 | U Kentucky | 37 | -11 | 54.74 |
| 49 | Penn State-Dickinson | NR | N/A | 54.71 |
| 50 | U Tennessee | 43 | -7 | 54.48 |
For those with different priorities, check out the new ATL Law School DIY where you can adjust the relative weights of 12 factors yourself to customize rankings based on your personal needs and goals.
Let's put it simply:
What happened last year?
The Class of 2023
Total Law Grads: 35,215
Methodology
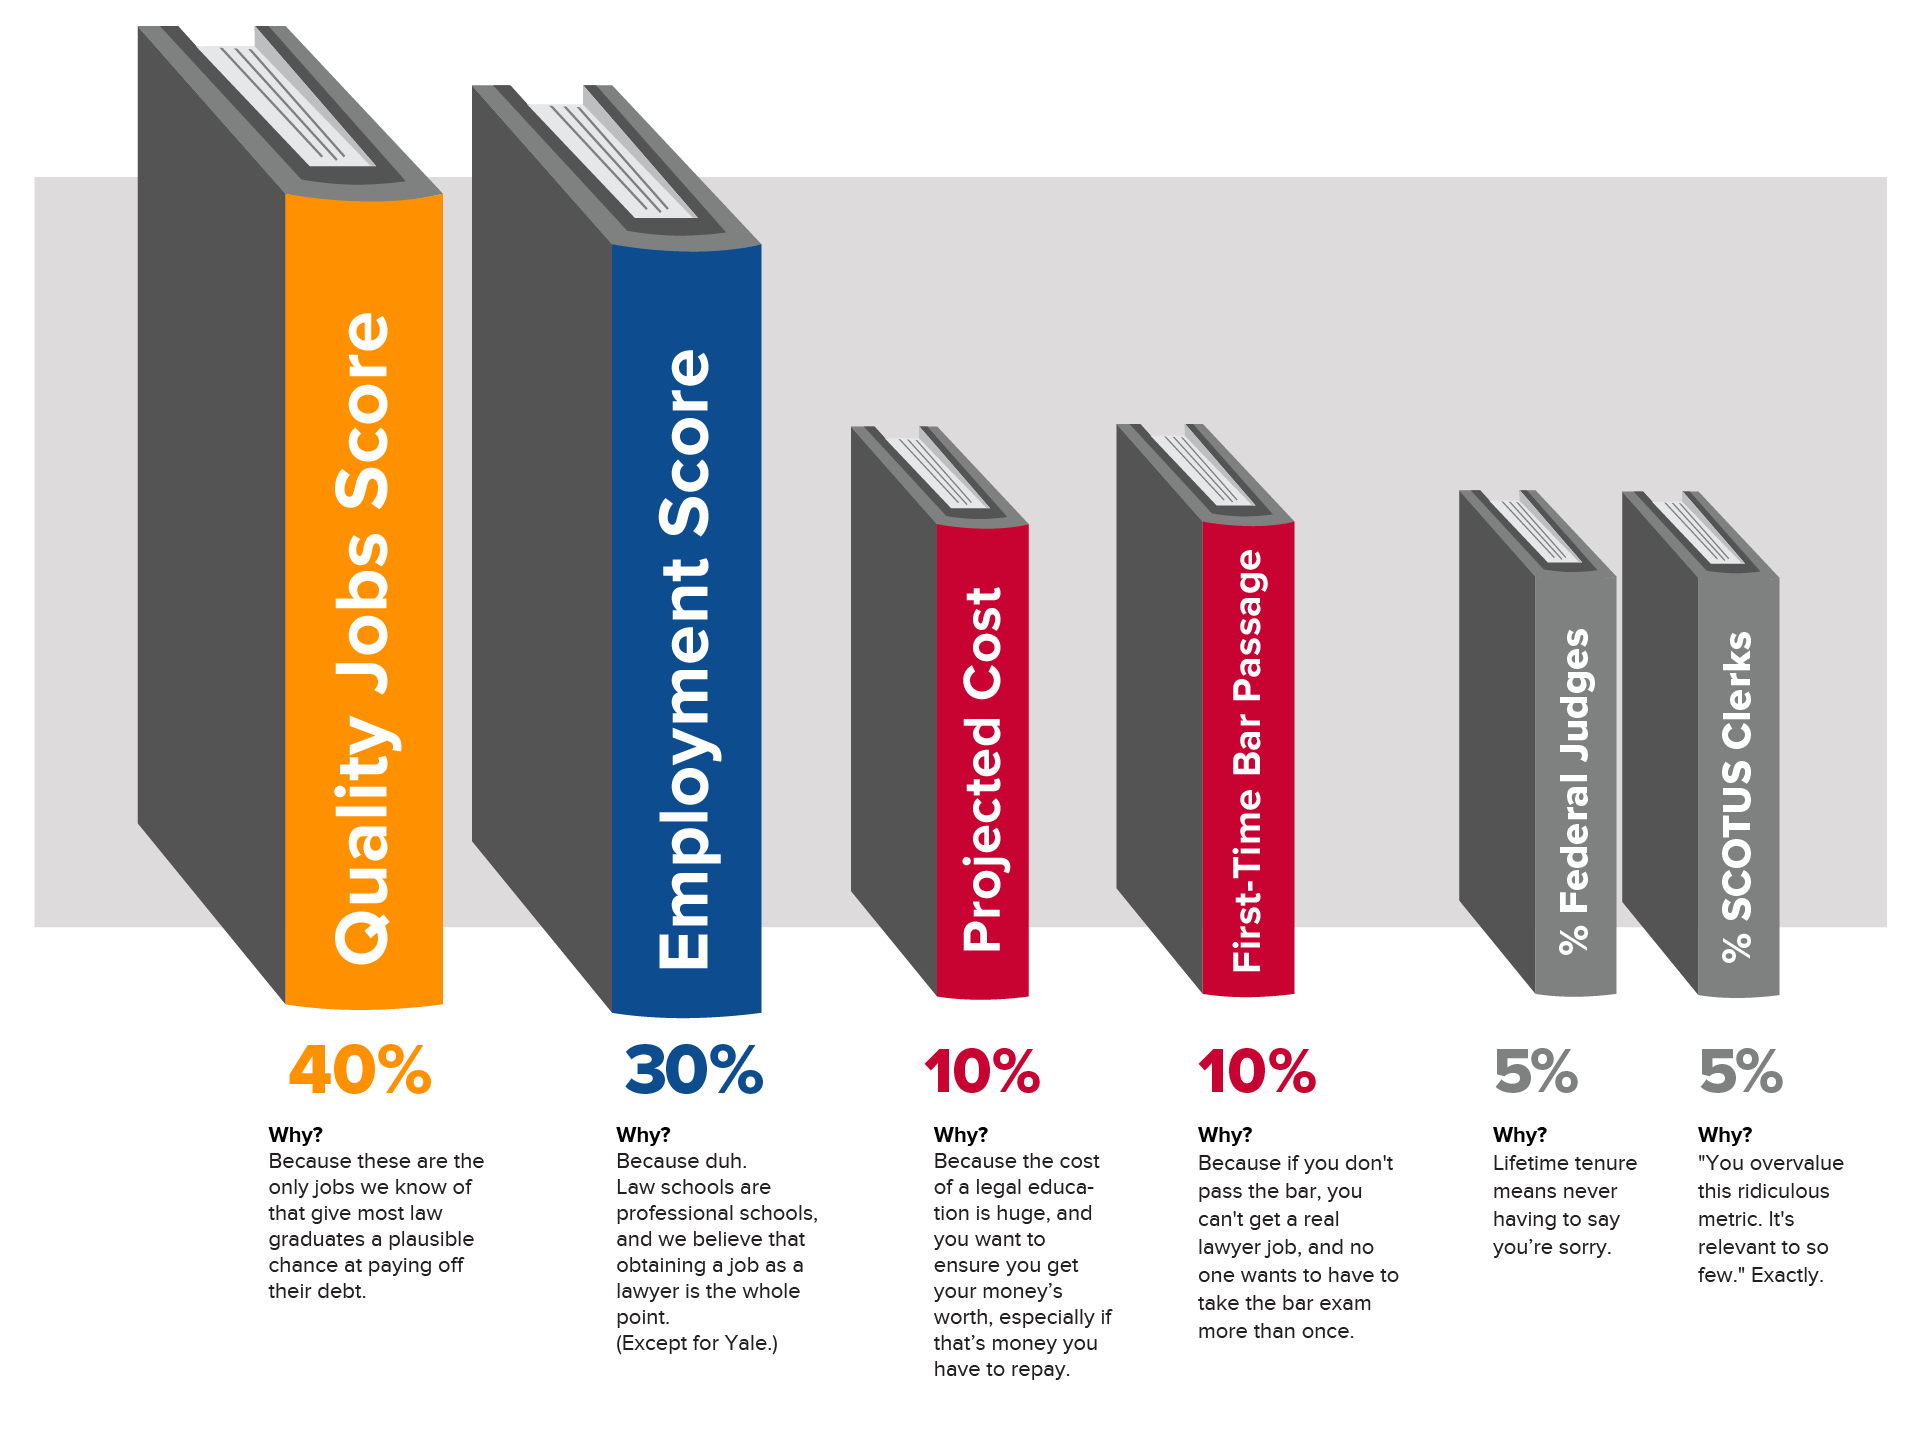
We prioritize employment outcomes above all else in comparing law schools. Therefore, these are the components of our rankings methodology:
Some further notes on methodology
QUALITY JOBS SCORE (40%)
This measures the schools’ success at placing students on career paths that best enable them to pay off their student debts. We’ve combined placement with the country’s largest and best-paying law firms (firms with 101+ attorneys) and the percentage of graduates embarking on federal judicial clerkships. These clerkships typically lead to a broader and enhanced range of employment opportunities. (Employment data from the American Bar Association.)
EMPLOYMENT SCORE (30%)
We only counted full-time, long-term jobs requiring bar passage (excluding solos and school-funded positions). Look, we know that there are some great non-lawyer jobs out there for which a J.D. is an “advantage.” It’s not as if these jobs don’t count; it’s that they can’t be compared in a meaningful way. The definition of “J.D. Advantage” changes from year to year and is based on a self-reported metric that defies independent third-party verification. One school’s apples are another school’s oranges, but we’re not going to count lemons. (Employment data from the American Bar Association.)
PROJECTED COST (10%)
The cost of a law school education matters not only to those students who take out loans to fund it, but also to those lucky enough to be able to pay for it outright. After all, law school is a major investment and how you view the return on that investment depends not only on the outcome (i.e., employment) but on how much you laid out to get there. And, because where you attend school plays a part in those expenses (e.g., three years living in New York City will leave a bigger hole in your bank account than three years in Lawrence, Kansas), we’ve also factored regional adjustments for cost of living into our scores for total cost. (Data on education cost courtesy of Law School Transparency.)
FIRST-TIME BAR PASSAGE RATE (10%)
If you want one of those full-time, long-term legal jobs that put you in the best position to pay off your law school debt, you’ll have to pass the bar exam. Even if a handful of states are considering licensing alternatives that don’t require the exam, for the most part, if you want to practice law at all, you need to pass the bar. And no one wants to have to sit through the bar exam more than once. Our formula factors in the percentage of each school’s first-time exam takers in 2023 who passed. (Bar passage data from the American Bar Association.)
SCOTUS CLERK & FEDERAL JUDGESHIP SCORES (5% EACH)
Though obviously applicable to very different stages of legal careers, these two categories represent the pinnacles of the profession. For the purposes of these rankings, we simply looked at a school’s graduates as a percentage of (1) all U.S. Supreme Court clerks (since 2019) and (2) currently sitting Article III judges. Both scores are adjusted for the size of the school. Obviously, we are aware that for the vast majority of students, Supreme Court clerkships or the federal bench are simply not prospects. But for the students who do want to be judges and academics, this outcome represents a useful separating factor for the most elite schools. Some schools put you in robes, others can’t.