 This week saw the release of the so-called “Panama Papers,” the largest document dump of all time, at least if measured by terabytes. The 11 million+ encrypted internal documents reveal the hidden financial dealings of some of the world’s most powerful people and their lackeys. It’s like the Ashley Madison hack, but but for lawyers and banksters. The implications of the leak might seem dizzyingly complex, but their gist can be distilled into this simple graph:
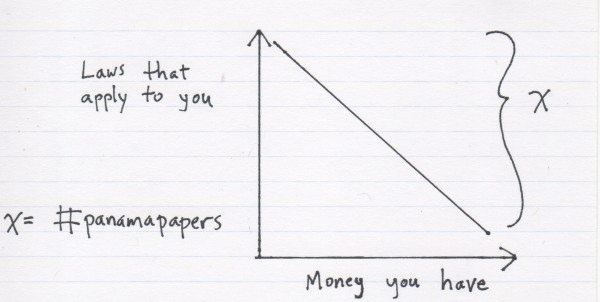
(Source: Unclear. Gavel bang: Ian Bremmer‘s Facebook page.)

Schenck Price Works Smarter with Lexis+ AI and Protégé
LexisNexis sat down with John Ursin, Managing Partner at Schenck Price, to learn how the firm is using legal AI to strengthen client service and daily legal work.
To add to the fun, Irish bookmaker Paddy Power has laid odds on the next world leader to resign over the Panama Papers’ revelations. The current leader is Argentine President Mauricio Macri at 8-1. Queen Elizabeth and Barack Obama at both at 66-1, Canada’s Prime Minister Justin Trudeau is at 80-1, and North Korea’s Kim Jong-un is at 100-1.